BUY PUNJ LLOYD WITH SSL 149.(10.00AM)
BUY INFOSYS SSL 1150(10.01AM)
SUPPORT FOR THE NIFTY AT 2922-2883 AND RESISTANCE AT 3005-3015.......(10.03AM)
BUY HDFC ABOVE 1490 SSL 1480(10.16AM)
BUY KOTAK BANK SSL 335(10.25AM)
BUY ICICI BANK SSL 420(10.29AM)
Wednesday, December 24, 2008
Tuesday, December 23, 2008
23th dec 08
support for nifty at 2982-2945.(9.51am)
suzlon weak below 59 ssl 61(1.14am)
buy indian oil above 415 ssl 410(10.2am)
nifty almost touches the first support 2982 does 2983.25(10.38am)
resistance for the nifty at 3025(10.43am)
buy rel infra ssl 585(12.45pm)
buy tata power ssl 725(12.53pm)
resistance for the nifty at 3005..strong if sustains above this level.(1.26pm)
buy larsen ssl 775(1.33pm)
buy rcom ssl 212(1.35pm)
buy rpl ssl 86(1.39pm)
buy punj lloyd above 153 ssl 149.75(1.44pm)
nifty at the second support..2945.(2.20pm)
buy icici bank ssl 424 above 429(3.1pm)
buy axis bank ssl 495(3.12pm)
Monday, December 22, 2008
22th DEC 2008
SUPPORT FOR NIFTY AT 3060 AND RESISTANCE AT 3096..STRONG ABOVE 3105.(10.06AM)
BUY PUNJ LLOYD ABOVE 170 SSL 167.(10.08AM)
BUY RNRL ABOVE 58 SSL 56(10.09AM)
BUY RCOM SSL 216(10.17AM)
INFOSYS WEAK BELOW 1165(10.37AM)
BUY LARSEN ABOVE 845 SSL 835(11.02AM)
MARKETS SHOWING WEAKNESS..BE CAREFULL(11.43AM)
WATCH STERLITE IND IF MOVES ABOVE 283 SSL 280...........(11.44AM)
ONGC SHOWING STRENGHT GOOD ABOVE 742..SSL 735(12.58PM)
ril weak sell below 1315ssl 1325(1.42pm)
nifty at crucial level 3060 be carefull (1.48pm)
sell sbi below 1290 ssl 1305(2.15pm)
support for nifty 3020 -3005(2.59pm)
Friday, December 19, 2008
19th DEC 2008
BUY PUNJ LLOYD SSL 159....(10.02AM)
BUY SBI SSL 1300.(10.40AM )
BUY RIL SSL 1335(10.43AM)
BUY RCOM SSL 210(11.17AM)
BE CAREFULL IF NIFTY BREAKS 3060(11.43AM)
SELL SBI BELOW 1285(12.13PM)
KEEP AN EYE ON CHAMBLE FERTILIZER SSL 40.(12.34PM)
SUPPORT FOR THE DAY FOR NIFTY AT 3030(10.09PM)
BUY REL INFRA ABOVE 615 SSL 608(1.53PM)
NIFTY TOOK SUPPORT AROUND 3036.(1.57PM)
IF RIL CROOSES 1380 WILL ROCK THE MKT .(2.02PM)
RESISTANCE LEVELS POSTED ON 13TH DEC ........RESISTANCE NOW AT 3090 IF CROSSES CAN ATTEMPT 3140.(2.11PM)
BUY SAIL ABOVE 88 SSL 86.5(2.36PM)
Thursday, December 18, 2008
18th Dec 2008
(12/18/2008 9:58:44 AM): resistance for nifty at 2977-2980-3051and support now at 2930
(12/18/2008 10:01:07AM) buy infosys ssl 1145
(12/18/2008 10:18:16 AM): buy ntpc above 176 ssl 173
watch sbi above 1230 ssl 1220.(11.14am)DOES 1305
nifty at crucial level(11.40am)DOES 3072
buy dlf ssl 255(12.13pm)DOES 280
buy ril ssl 1310(12.25pm)DOES 1372
buy tisco above 213 ssl 209.(12.45pm)DOES 227
BUY AXIS BANK SSL 512(1.34PM)DOES 543
BUY 3100CALL OPTION NOW AT 41-43(2.47PM)DOES 52-54.
Wednesday, December 17, 2008
17th DEC 2008
Corporate advance tax collections in Mumbai have grown
by 20% in Apr-Dec'08.
Advance tax nos
(Rs mn) Q3 FY08 Q3 FY09 % change
SBI 10,880 17,000 56.3
BoI 2,100 3,700 76.2
BoB 2,000 2,200 10.0
Central Bank Of India 730 1,630 123.3
HDFC Bank 2,800 2,500 -10.7
ICICI Bank 5,000 4,700 -6.0
IndusInd Bank 200 220 10.0
HDFC 2,150 2,790 29.8
LIC Housing 330 440 33.3
Reliance Industries 5,190 4,400 -15.2
L&T 1,800 3,120 73.3
Tata Chemicals 570 830 45.6
TCS 1,080 1,290 19.4
Tata Steel 7,500 2,300 -69.3
Tata Sons 1,450 400 -72.4
Tata Power 250 280 12.0
Ultratech 1,400 650 -53.6
Mahindra & Mahindra 600 40 -93.3
17THDEC 2008
BUY ORCHID CHEM WITH STRICT STOPLOSS OF 96 FOR THE TARGET OF 115-120.(9.45am)
SELL DLF SSL 277 FOR THE TARGET 245-225.(10.15AM)
BUY SBI SSL 1225.(11.03AM)
PUNJ LLOYD GIVEN YESTERDAY ROCKING TODAY --TARGET 177.(11.10AM)
BUY STERLITE SSL 281.GOOD ABOVE 294.(11.15AM)
BUY NIFTY FUT...........CALL 3100 NOW AT 42-43.(12.15PM)
Nagarjuna fert. and Chamble fer recommended on sunday moving.(1.17PM)
nifty stop loss 2995.(2.00pm)
Tuesday, December 16, 2008
Monday, December 15, 2008
Saturday, December 13, 2008
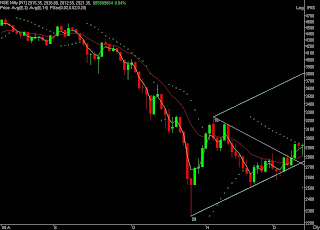
NIFTY INTRA DAY CHART: 13TH DEC 08
Hi,
I see some macro factors emerging positive for Indian equity.
1. I see a possibility of $ peaking out to Rs now in few weeks and gradually start downward journey. Rs should appreciate in next 12 months,
2. If Rs shows signs of appreciation, expect funds flowing in India; both FDI and FIIs
3. If petro products are priced at parity to crude prices (petrol and Diesel), it will take care of deficit problem which sends a positive signal on Rs appreciation as $ inflow could indeed start due to re-rating prospects
4. This should re-rate equity to begin with
5. It should also act positive on interest rate scenerio as inflation should be going down faster to 5-6% in following months.
6. Fall in inflation is positive, as fall in interest rate is inevitable thereafter (G-sec bond yield is 6.4% now, confirming southward journey of interest rate)
7. Treasury gains for banking stocks
8. Equity yeild contracting the bond yield now should prompt higher fund allocation
9. Given this possibility in next 2-3 quarters, I would build a strong bias for equity and would buy equity during each fall now onwards as it may make a rounding bottom formation on long term charts which in turn sets the base for a long term bull market in following 4-5 years.
Positive developments can indeed take care of potential sell-off from HFs of Q1; it may be an opportunity to invest in falling market. Worth planning actions to invest and build AUM.
Have a nice day.
Sincerely,
From: Deven Choksey
Managing Director
Kisan Ratilal Choksey Shares and Securities Pvt. Ltd.
Mumbai,
INDIA.
Saturday, October 4, 2008
DOW AND NIFTY SUPPORT ANALYSYS
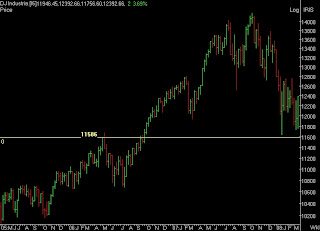
Looking at the history of the dow index..........i feel that dow should take support around 9500-9000 levels and pull back than can take the dow till 11000-11750............comparing the same data with the nifty i feel in extreme case nifty may try and come down between 3600-3400........but this levels r strong case of investment and returns at that levels have always deliverd good rtns.........pull back can take the nifty till 4200-4300...........any move beyond the levels can be analysed there after.
Saturday, June 14, 2008
SUPPORT AND RESISTANCE LEVELS.
Mkt seems to be trying hard to move up but nifty is range bound between 4550 and 4460 and nifty fut is range bound between 4550-4390 and also at a discount to cash which indicates weakness . once they cross the higher end then only we can confirm that mkt can move up or not. If breaks the lower side than the fear will set in and mkts will be headed lower. On lower side support for nifty fut exist at 4270-4110-4084-3990 and for nifty cash support exist at 4271-4195-3990 and on the higher side resistance for nifty cash exist at 4629-4732-4932 and for niftyt fut at 4637-4759-5054. and for the sensex support exist at 14500-14270-13910-13086-11925 and resistance at 15780-16050-16280-16508.
Sunday, May 18, 2008
190808--SCRIPS OFTHE NEXT FEW WEEKS.KEEP AN EYE ON THEM
SCRIP NAME- BUY ABOVE -SSL -TGT-1 TGT-2
ADI BIRLA NOVA 1550- 1444 -1651- 1796
ASAHI IN. GLASS 61- 45- 75- 86
AXIS BANK 917- 869 -969- 1020
ABAN OFF 3915- 3700- 4607- 4748
ANDHRA PETRO 25 -21 -28- 35
ESCORTS 112 -106 -126 -133
GDL 124 -116- 143- 148
GUJ ALKALI 192- 180 -200- 220
GNFC 0-165 -183- 193
HIMADRI CHEM 0-403- 486 -500
HIND CONST 0-131 -149- 153
INDIAN OIL 415- 390- 430- 440
JAI PRA 274- 265 -287 -295
LITL 535 -516 -598- 611
LIC HOUSING 354- 342 -378 -390
MAH GESCO 0- 617 -692 -715
MCLEOD RUSSE 108 -100- 115- 130
MOSER BEAR 201- 181 -217 -237
NICH. PIRAMAL 360- 342- 388- 402
NIIT TECH 155 -147- 162- 170
OBC 214- 208 -221 -230
RANBAXY LAB 517 -500 -543- 561
RCF 78 -72- 92- 101
ROLTA 327 -210 -347 -355
SKUMAR NAT. 115 -107 -121 -130
SPICE TELE 0-40 -48- 51
STERLITE 0-878 -990 -1105
UNITED PHOSP 357- 346 -368 -387
VSNL 515 -500- 537 -554
Thursday, May 1, 2008
TATA STEEL LTD.
STERLITE TECH. LTD.
SAIL LTD.
NEYVELLI LIGNITE
NATIONAL ALUM
ITC LTD
CEREBRA INTE
Cerebra Inte 532413 can be bought at current levels and accumulate if come lower for the first target of 125+.
HERO HONDA
Hero Honda 25th Feb 2008 has moved beyond 786 and now at 848…partial profit can be booked between 875-900.once if moves beyond 900 expect the target of 1045-1110.
MARUTI SUZUKI
Saturday, March 29, 2008
Reliance Industries
Friday, March 21, 2008
INDIAN MARKETS

Analyzing the previous falls in the Sensex and Nifty Fut. We see that the first major fall in case of Sensex was 32% from h-1 and in case of Nifty fut. was almost 38%from H-1
(BLACK FRIDAY).The second fall in case of Sensex was 31% from H-2 and in case of Nifty fut. was also 31%from H-2.
In such case the support for the Sensex should be considered between 14208 which come to 33% from the all time high (21206) or 13780 which is the low (low of 17th Aug 2007) and can form a minor double bottom too and in case of Nifty Fut. 4245 which come to 33% from the all time high of 6336 or the support of the previous high S-3 which is 4239.
Saturday, March 8, 2008


Markets are falling and fear is setting in, Investors are worried as to what will happen next. Should we sell and book the losses on what we are holding is the question on everyone’s mind.
No just wait for a few weeks.
From the previous movements of Sensex and Nifty future seen on the charts attached it seems that the bottom is about to be formed.
After creating a new top as per the previous moves at T-2 the bottom B-2 was formed just below the previous top T-1, the bottom B-3 was formed just below the previous top T-2.
So the bottom B-4 should be formed just below the previous top T-3 which can be around 15320 and 14700 for the Sensex and 4570 and 4230 for Nifty fut.
Wait for the bottom to be formed in the coming weeks.
I would advise investors to accumulate stocks from here as the India story is still alive.
Everyone talk of higher tops when the markets are making new highs and so is now everyone talking of new bottoms when the market is going down. Don’t get carried away with the talks on the streets. Be patient and invest in good quality stocks from here on.
Sunday, March 2, 2008
Subscribe to:
Posts (Atom)


